sklearn Boston Dataset
Jump to navigation
Jump to search
An sklearn Boston Dataset is a all-numeric labeled dataset based on (Harrison & Rubinfeld, 1978)'s dataset (of sales in Boston).
- Context:
- It can (typically) be used for an sklearn Boston Dataset-based Regression System Evaluation Task.
- It can (typically) have 506 data rows.
- It can (typically) have 13 predictor columns with real positive data values.
- It can (typically) have 1 target column with real data values between ...
- Example(s):
- Counter-Example(s):
- See: Regression System Evaluation.
References
2016
boston house-prices dataset (regression).
Samples total 	506
Dimensionality 	13
Features 	real, positive
Targets 	real 5. - 50.
type (boston)
# >>> sklearn.datasets.base.Bunch
2016
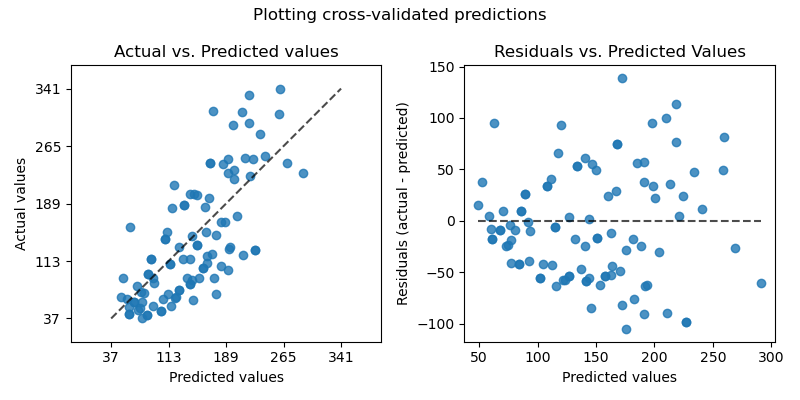
import sklearn.datasets
from sklearn.model_selection import cross_val_predict
import sklearn.linear_model
import matplotlib.pyplot as plt


lr = linear_model.LinearRegression()
boston = datasets.load_boston()
y = boston.target


# cross_val_predict returns an array of the same size as `y` where each entry
# is a prediction obtained by cross validation:
predicted = cross_val_predict(lr, boston.data, y, cv=10)


fig, ax = plt.subplots()
ax.scatter(y, predicted, edgecolors=(0, 0, 0))
ax.plot([y.min(), y.max()], [y.min(), y.max()], 'k--', lw=4)
ax.set_xlabel('Measured')
ax.set_ylabel('Predicted')
plt.show()
2011
- https://github.com/scikit-learn/scikit-learn/blob/master/sklearn/datasets/descr/boston_house_prices.rst
- QUOTE: Data Set Characteristics:
:Number of Instances: 506
:Number of Attributes: 13 numeric/categorical predictive
:Median Value (attribute 14) is usually the target


: Attribute Information (in order):
       - CRIM     per capita crime rate by town
       - ZN       proportion of residential land zoned for lots over 25,000 sq.ft.
       - INDUS    proportion of non-retail business acres per town
       - CHAS     Charles River dummy variable (= 1 if tract bounds river; 0 otherwise)
       - NOX      nitric oxides concentration (parts per 10 million)
       - RM       average number of rooms per dwelling
       - AGE      proportion of owner-occupied units built prior to 1940
       - DIS      weighted distances to five Boston employment centres
       - RAD      index of accessibility to radial highways
       - TAX      full-value property-tax rate per $10,000
       - PTRATIO  pupil-teacher ratio by town
       - B        1000(Bk - 0.63)^2 where Bk is the proportion of blacks by town
       - LSTAT    % lower status of the population
       - MEDV     Median value of owner-occupied homes in $1000's
: Missing Attribute Values: None
: Creator: Harrison, D. and Rubinfeld, D.L.


This is a copy of UCI ML housing dataset. http://archive.ics.uci.edu/ml/datasets/Housing
This dataset was taken from the StatLib library which is maintained at Carnegie Mellon University.
