sklearn.linear model
Jump to navigation
Jump to search
A sklearn.linear_model is a collection of generalized linear model fitting systems within scikit-learn.
- AKA: Scikit-learn Generalized Linear Model Class.
- Context:
- It require to call/select a generalized linear model regression system :
sklearn.linear_model.Linear_Model_Name(self, arguments)or simplysklearn.linear_model.Linear_Model_Name()where Linear_Model_Name is the name of the selected generalized linear model regression system.
- It require to call/select a generalized linear model regression system :
- Example(s):
sklearn.linear_model.LinearRegression()[1]], a Linear Regression System.sklearn.linear_model.Ridge()[2], a Ridge Regression System.sklearn.linear_model.ARDRegression(), a ARD Regression System.sklearn.linear_model.BayesianRidge(), a Bayesian Ridge Regression System.sklearn.linear_model.ElasticNet(), an ElasticNet_System.sklearn.linear_model.ElasticNetCV(), an ElasticNet Cross-Validation System.sklearn.linear_model.HuberRegressor(), a Huber Regression System.sklearn.linear_model.Lars(), a Least Angle Regression System.sklearn.linear_model.LarsCV(), a Least Angle Regression Cross-Validation System.sklearn.linear_model.Lasso(), a LASSO System.sklearn.linear_model.LassoCV(), a LASSO Cross-Validation System.sklearn.linear_model.LassoLars(), a LASSO-LARS System.sklearn.linear_model.LassoLarsCV(), a LASSO-LARS Cross-Validation System.sklearn.linear_model.LassoLarsIC(), a LASSO-LARS Information Criteria System.sklearn.linear_model.LinearRegression(), an Ordinary Least-Squares Linear Regression System.sklearn.linear_model.MultiTaskLasso(), a Multi-Task Lasso System.sklearn.linear_model.TheilSenRegressor(), a Theil-Sen Regression System.sklearn.linear_model.LogisticRegression().- …
- Counter-Example(s):
sklearn.kernel_ridge Kernel Ridge Regressionsklearn.manifold, a collection of Manifold Learning Systems.sklearn.tree, a collection of Decision Tree Learning Systems.sklearn.ensemble, a collection of Decision Tree Ensemble Learning Systems.sklearn.metrics, a collection of Metrics Subroutines.sklearn.covariance,a collection of Covariance Estimators.sklearn.cluster.bicluster, a collection of Spectral Biclustering Algorithms.sklearn.neural_network, a collection of Neural Network Systems.
- See: Python-based Logistic Regression.
References
2017a
- (scikit-kear, 2017) ⇒ http://scikit-learn.org/stable/modules/classes.html#module-sklearn.linear_model Retrieved:2017-09-24
- The sklearn.linear model module implements generalized linear models. It includes Ridge regression, Bayesian Regression, Lasso and Elastic Net estimators computed with Least Angle Regression and coordinate descent. It also implements Stochastic Gradient Descent related algorithms (...)
2017b
- http://scikit-learn.org/stable/modules/linear_model.html
- QUOTE: The following are a set of methods intended for regression in which the target value is expected to be a linear combination of the input variables. In mathematical notion, if \hat{y} is the predicted value: [math]\displaystyle{ \hat{y}(w, x) = w_0 + w_1 x_1 + ... + w_p x_p }[/math] Across the module, we designate the vector w = (w_1, ..., w_p) as coef_ and w_0 as intercept_.
To perform classification with generalized linear models, see Logistic regression.
- QUOTE: The following are a set of methods intended for regression in which the target value is expected to be a linear combination of the input variables. In mathematical notion, if \hat{y} is the predicted value: [math]\displaystyle{ \hat{y}(w, x) = w_0 + w_1 x_1 + ... + w_p x_p }[/math] Across the module, we designate the vector w = (w_1, ..., w_p) as coef_ and w_0 as intercept_.
2016
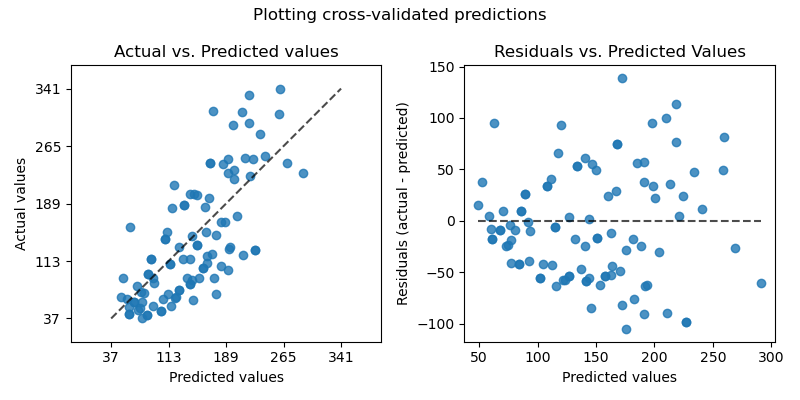
import sklearn.datasets
from sklearn.model_selection import cross_val_predict
import sklearn.linear_model
import matplotlib.pyplot as plt


lr = linear_model.LinearRegression()
boston = datasets.load_boston()
y = boston.target


# cross_val_predict returns an array of the same size as `y` where each entry
# is a prediction obtained by cross validation:
predicted = cross_val_predict(lr, boston.data, y, cv=10)


fig, ax = plt.subplots()
ax.scatter(y, predicted, edgecolors=(0, 0, 0))
ax.plot([y.min(), y.max()], [y.min(), y.max()], 'k--', lw=4)
ax.set_xlabel('Measured')
ax.set_ylabel('Predicted')
plt.show()