Budget-to-Actuals Variance Report
Jump to navigation
Jump to search
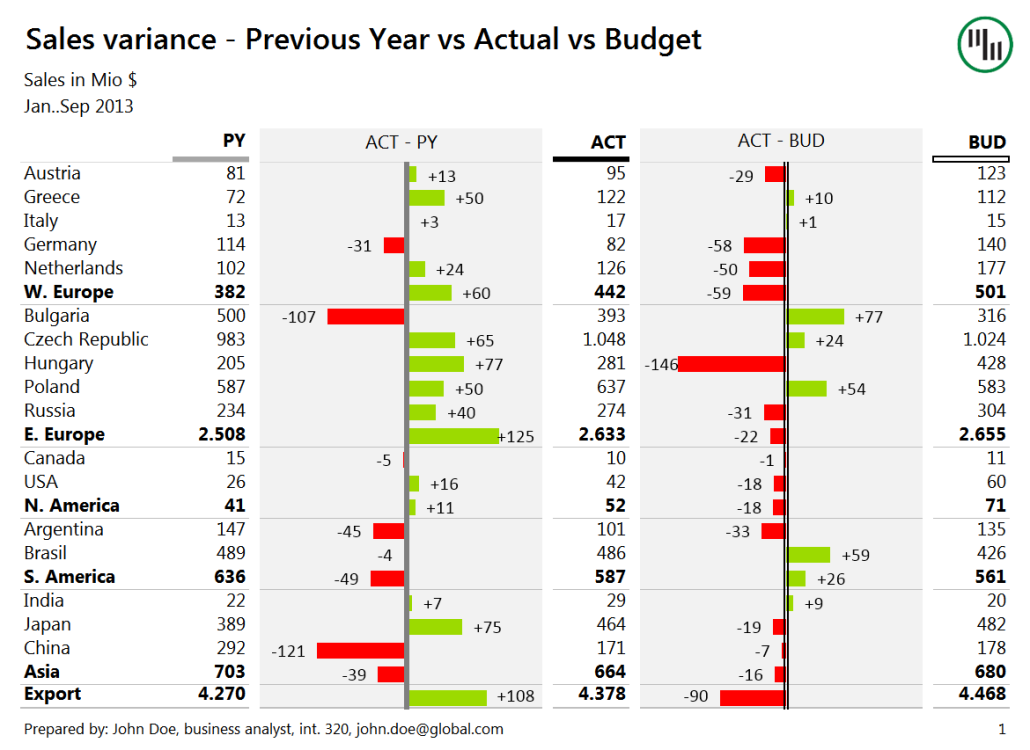
A Budget-to-Actuals Variance Report is a variance report with budget/actual variances (between planned financial outcomes and actual financial outcomes).
- Context:
- It can be based on a Monthly Actuals Report.
- It can (typically) be the input to a Budget-to-Actuals Analysis Task.
- It can (typically) support a Budgetary Control Process.
- It can be combined with a Budget-to-Forecasts Variance Report.
- …
- Example(s):
- Counter-Example(s):
- a Multi-Year Budgetary Forecast Report.
- a Historical Budget Report, such as [2]
- See: Variance Analysis, Organizational Budget, Budget Proration Report.
References
2015
- http://www.leoisaac.com/budget/bud025.htm
- QUOTE: The purpose of a "Variance Report" as shown below is to identify differences between the planned financial outcomes (the Budget) and the actual financial outcomes (The Actual). The difference between Budget and Actual is called the 'Variance". The Variance is depicted below in dollar ($) and percent (%) terms. Calculating the variance in percent (%) is useful as it gives the relative size of the variance. When calculating the Variance in percent (%) - divide the Variance in dollars ($) by the Budget (and not by the Actual).
2014
- http://support.zebrabi.com/variance-analysis/ http://zebrabi.com/features/
- QUOTE: Variance Analysis is probably the most required and frequently used analysis in business reporting. …
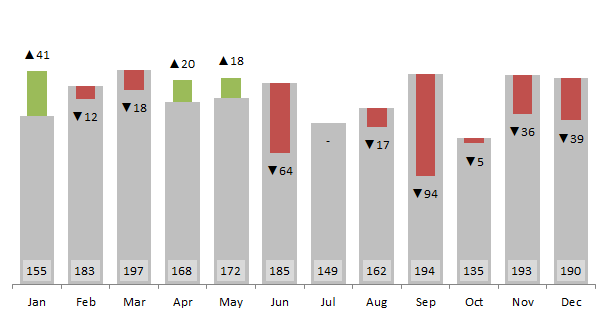
… A plus-minus (also called "red-green") chart automatically colors columns or rows green or red depending on the value of the variance (whether it is positive or negative). This is the most intuitive way to visualize deviations (e.g. from plan or budget, from previous year, etc.) or profit/loss. …

- QUOTE: Variance Analysis is probably the most required and frequently used analysis in business reporting. …
