Daily Active Users to Monthly Active Users (DAU/MAU) Ratio
A Daily Active Users to Monthly Active Users (DAU/MAU) Ratio is a user engagement ratio measure that quantifies product stickiness by dividing daily active user count by monthly active user count.
- AKA: DAU/MAU Ratio, Stickiness Ratio, Daily Engagement Ratio.
- Context:
- It can typically measure DAU/MAU Product Stickiness by calculating the DAU/MAU percentage of monthly active users who engage with a digital product daily.
- It can typically provide DAU/MAU Retention Insight by indicating the DAU/MAU engagement frequency of user base.
- It can typically serve as a DAU/MAU Health Indicator for digital products and digital services.
- It can typically help evaluate DAU/MAU Product Value by revealing how user engagement patterns translate to daily usage habits.
- ...
- It can often be a DAU/MAU Lagging Measure that reflects the results of previous product decisions and feature implementations.
- It can often predict DAU/MAU Revenue Potential for ad-supported digital products where daily user exposure directly impacts revenue generation.
- It can often complement other DAU/MAU engagement metrics like session length, user retention rate, and feature adoption rate.
- It can often vary based on DAU/MAU industry standards and DAU/MAU product category.
- ...
- It can range from being a Low Daily Active Users to Monthly Active Users (DAU/MAU) Ratio to being a High Daily Active Users to Monthly Active Users (DAU/MAU) Ratio, depending on its DAU/MAU user engagement strength.
- It can range from being a Declining Daily Active Users to Monthly Active Users (DAU/MAU) Ratio to being a Growing Daily Active Users to Monthly Active Users (DAU/MAU) Ratio, depending on its DAU/MAU trend direction.
- ...
- It can have DAU/MAU Measurement Period Variations based on different DAU/MAU calculation timeframes and DAU/MAU rolling windows.
- It can have DAU/MAU Benchmark Differences across DAU/MAU product types, DAU/MAU industry segments, and DAU/MAU user demographics.
- It can integrate with DAU/MAU Business Intelligence Systems for DAU/MAU performance tracking and DAU/MAU trend analysis.
- ...
- Examples:
- DAU/MAU Ratio Social Media Platforms, such as:
- Facebook DAU/MAU Ratio (typically above 50%), demonstrating high DAU/MAU product stickiness.
- Twitter DAU/MAU Ratio (approximately 42% in 2022), reflecting moderate DAU/MAU user engagement strength.
- Instagram DAU/MAU Ratio (approximately 66% in 2023), showing strong DAU/MAU daily usage habits.
- DAU/MAU Ratio Mobile Applications, such as:
- WhatsApp DAU/MAU Ratio (approximately 75% in 2023), exhibiting very high DAU/MAU product stickiness.
- TikTok DAU/MAU Ratio (approximately 68% in 2023), demonstrating strong DAU/MAU user engagement patterns.
- Mobile Game DAU/MAU Ratios (typically 10-30%), showing lower DAU/MAU engagement frequency compared to communication apps.
- DAU/MAU Ratio SaaS Products, such as:
- Slack DAU/MAU Ratio (approximately 65% on workdays), reflecting strong DAU/MAU product value in work settings.
- Productivity App DAU/MAU Ratios (typically 20-40%), demonstrating moderate DAU/MAU user engagement strength.
- B2B SaaS DAU/MAU Ratios (varying by solution type), showing context-dependent DAU/MAU usage patterns.
- ...
- DAU/MAU Ratio Social Media Platforms, such as:
- Counter-Examples:
- Customer Churn Rate, which measures user attrition rather than DAU/MAU engagement frequency.
- Monthly Active Users (MAU), which measures total active user count without relating it to DAU/MAU daily engagement.
- Session Depth Metric, which focuses on user interaction quality within sessions rather than DAU/MAU engagement frequency.
- Quarterly Active Users (QAU), which measures active user count over a longer timeframe than DAU/MAU ratio.
- See: User Engagement Measure, Product Stickiness Metric, Digital Product Performance Indicator, User Retention Metric, App Analytics Measure.
References
2018
- https://andrewchen.co/dau-mau-is-an-important-metric-but-heres-where-it-fails/
- QUOTE: ... This metric was always impressive for Facebook because it’s always been high. It’s historically been >50%. In fact, I was curious at one point whether or not it’s always been that good. And it has! I found this from a Facebook 2004 media kit showing crazy high numbers even with a small base of 70k users:
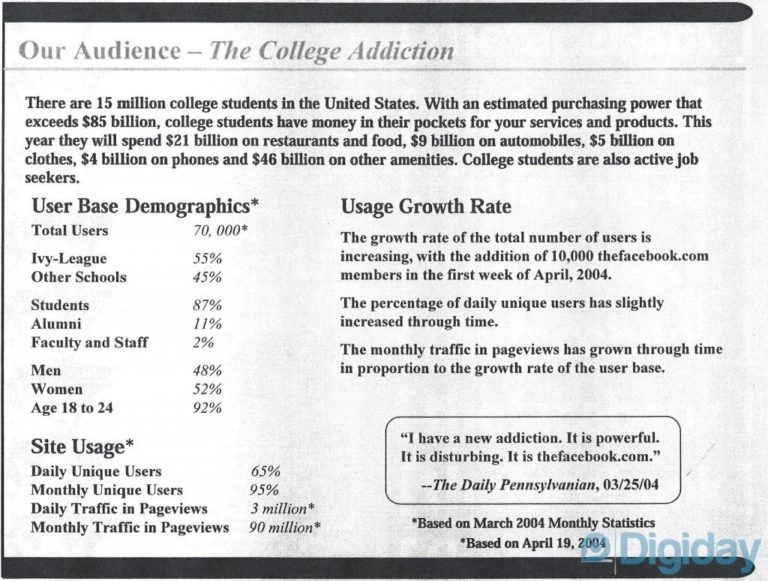 ...
... ... a lot of people seem to implement emails and push notifications thinking it’ll help. My experience is that it tends to increase casual numbers (the MAU) but not the daily users. In other words, it’ll actually lower your DAU/MAU to focus on notifications because you’ll grow your MAUs more highly than your DAUs. ...
... In conclusion, if your product is a high-frequency, high-retention product that’s ultimately going to be ads supported, DAU/MAU should be your guiding light. But if you can monetize well, develop network effects, or quite frankly, your natural cadence isn’t going to be high – then just measure something else!
- QUOTE: ... This metric was always impressive for Facebook because it’s always been high. It’s historically been >50%. In fact, I was curious at one point whether or not it’s always been that good. And it has! I found this from a Facebook 2004 media kit showing crazy high numbers even with a small base of 70k users:
2016
- http://mygamehud.com/post/49/dau-mau-ratio
- QUOTE: The DAU / MAU Ratio strives to show the percentage of Monthly Active Users (MAU) that return to play your game each day. It is calculated by dividing your Daily Active Users (DAU) by your MAU.
2015
- http://geckoboard.com/learn/kpi-examples/startup-kpis/dau-mau-ratio/
- QUOTE: The Daily Active Users (DAU) to Monthly Active Users (MAU) Ratio measures the stickiness of your product - that is, how often people engage with your product. DAU is the number of unique users who engage with your product in a one day window. MAU is the number of unique users who engage with your product over a 30-day window (usually a rolling 30 days).